Introduction
One of the problem aspects in digital image forensics is the explanation of technical issues that are difficult to understand
for laypeople. Even if the evidence of tampering is completely clear, pure technical papers are not comprehensible for the
general public. There is the likelihood that sprawling complex description texts will not create acceptance. In the worst case,
it causes an offensive negative attitude.
The most accepted and widely understandable method that also provides many starting points for laypeople, is the
detection of simple image compositions that can be found by the reverse image search function using major search engine providers.
To see exactly where and in what manner a manipulation has been performed, is universally accepted as most persuasive evidence.
For reconnaissance work that involves the public, visualization is one of the most effective means but it does not have to be the best.
A visual method which has found its way in digital image forensics is called Error Level Analysis. However, there is a risk of
misapplication. The use of ELA methodology must always be considered very carefully.
ELA Analysis
Error Level Analysis is based on characteristics of image formats that are based on lossy image compression. This method
can highlight areas of an image which has different degrees of compression. Especially the JPEG format (one of the most
popular image formats on the Internet) can be applied particularly well using this method. The procedure is surprisingly simple.
For a better understanding it is necessary to know how images in JPEG format are created. JPEG uses a lossy image
compression. Each re-encoding process (new saving) performed on the image leads to further loss of quality. The JPEG algorithm
is based on a 8x8 pixel grid. Each 8x8 square grid is thereby treated and compressed separately. If the image is untouched,
then all these 8x8 squares will show the same error level potential.
If the jpeg image is saved again, then each square should be continuously reduced to approximately the same level. In the
ELA process, the original image that is being examined will be resaved at a certain JPEG quality level (for example, at 75%).
The resave leads to a known degree of compression, which extends over the entire image. The newly saved image is used to be
compared with the original image. The human eye would hardly notice a change. Therefore, the ELA representation will visualize
in particular only the difference between the two images. So, the resulting ELA image shows the varying degrees of compression
potentials.

Click to enlarge this image
Behind the method of detecting tampered JPG images stands the idea that if an image has been edited, then every 8x8 square that
is affected by the change, comprises a higher error level potential than the rest of the image.
Case Studies
Even without manipulation an image, the ELA view will show different areas in original images that come
to the fore. These natural characteristics have to be known, if you want to be able to prove manipulations using this
approach. (However, Error Level Analysis also has its limitations. This will be explained in the following chapters.)
The ELA view highlights the different compression potentials produced in an image. Areas with uniform color,
such as a cloudless blue sky or a bright white wall showing dark ELA results compared to the strongly contrast edges
areas that occur much brighter in appearance.

Click to enlarge this image
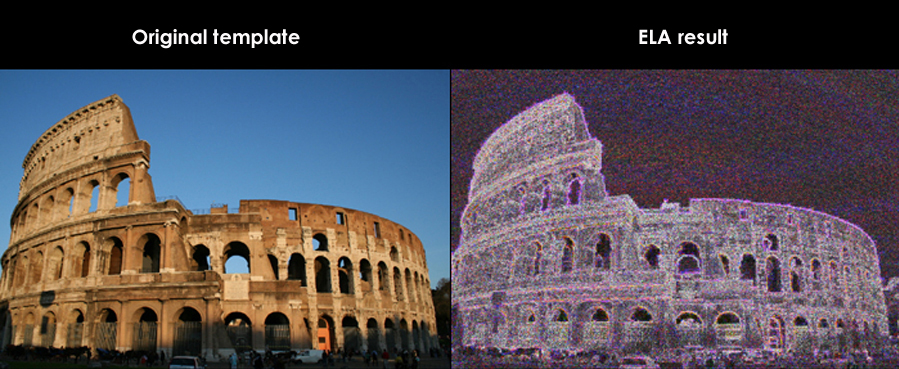
Homogeneous image regions like the sky on the example photo of the Colosseum can be compressed efficiently.
Due to this, the compression potential is low at a recompression cycle respectively in a new saving and results
in darker color on the ELA view. By contrast, irregular patterns containing fine contours and complex color
and brightness gradients will show just few redundancies, which can not be reduced so well.
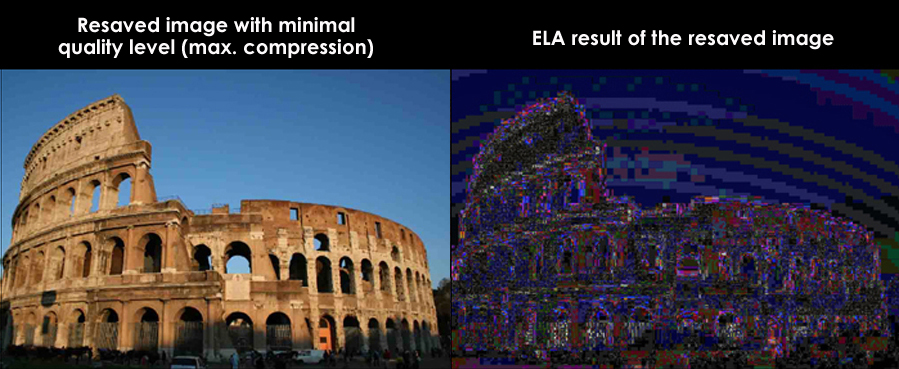
Repeated saving of a JPG image removes high-frequency parts of an image and reduces the differences between
strongly contrasting edges, textures and surfaces. A JPG image that is stored in the lowest quality level
is displayed accordingly much darker than at higher quality levels.

Click to enlarge this image
A JPEG file that creates a custom Huffman table based on statistical analysis of the respective image content, is
called Progressive JPEG. Images generated by digital cameras, however, are not optimized in this way.
Original shots from digital cameras should always have a high degree of change after a new save and thus have
relatively bright areas in the ELA result. The very dark ELA result in the image example (showing the
Colosseum) that has been stored in lower quality level, is a clearly recognizable indication that this image
is in no way an original JPEG file that was downloaded directly from the camera.
The following series of examples illustrates how a unique tamper evidence can look like by using the ELA approach.
Even without being in possession of the original image (A1), the ELA view can show,
where something has been changed in the image (A4).
Click to enlarge an image of the cutouts
JPG images, which are stored in the lowest quality level (or maximum compression), appear very dark in the ELA result view (Example B2).
If we add copied elements out of an image template that existed in higher quality level, than this will be clearly apparent in the ELA view (B4) by the much brighter areas.
These copied elements have a considerably higher compression potential in contrast to the rest of the image.
Click to enlarge an image of the cutouts
Manipulated - yes or no? It is not always possible to give a clear answer. Sample images, such as those shown above, clearly indicate the selective manipulation.
But only in special cases like these ones the ELA methodology can show its strengths. However, ELA also have clear limits.
The Bellingcat Case
An incident that shows how the ELA methodology can be used too recklessly, is the
Bellingcat report ,
that intends to pinpoint evidences for russian tampering of satellite images showing the crash site of the plane of "Malaysia Air MH17".
On June 2015, the German online news service "Spiegel.de" had published an
article ,
that intends to pinpoint evidences for russian tampering of satellite images showing the crash site of the plane of "Malaysia Air MH17".
On June 2015, the German online news service "Spiegel.de" had published an
article with the results of the Bellingcat report.
Shortly after the editorial staff had to publish a
relativizing reply and admit errors in journalistic research work because of fierce criticism.
This new article also contains the review of the German image forensic specialist
Jens crisis who commented very critically the Bellingcat report in an appropiate interview
 . .
The US forensics expert Dr. Neal Krawetz (founder of the online service FotoForensics.com), too, is quoted with the statement that
what Bellingcat is doing is nothing more than reading tea leaves. What exactly is to criticize on the Bellingcat report?
The Bellingcat report is based on more than just interpretations of ELA results. Essential components of the analysis describes
verifiable changes in vegetation-tracks on the various satellite images and inconsistencies of details presented during the Russian press conference.
It can be shown that the newspaper published satellite photos that are falsly dated were digitally altered by Adobe Photoshop CS5.
However, the latter is a logical corollary, since the published images have been added with explanatory texts and markings.
For these insertions it is necessary to use an image editing program.
It should be left to the reader to evaluate the Bellingcat report as a whole in its conclusions.
The Bellingcat report is considered here only in terms of dealing with the ELA methodology that makes out a significant portion of the report.
The intention is to show that representation results produced by ELA methodology can very easily lead to critical
mis- and over-interpretations of the results.
In the embodiments of the Bellingcat reports, tested by Error Level Analysis of one of the published satellite photos, the areas with different levels of compression are marked with letters (A to E). In particular, it should be noticed the different compression ratio of the
right cloud formation (section D) and the visible soil characteristics in the middle (area C).
These differences may be explained by the fact that a cloud formation was subsequently inserted into the receptacle to hide compromising content.
The figure shows the left portion, published by the website of the Russian Defense Satellite View and on the right side the display result by the Error Level Analysis.

Click to enlarge this image
Quotation of the Bellingcat report (p.11):
"The difference in the error levels between areas D and C cannot be explained by the image’s content.
While error level differences may be caused by blurry image content, the clouds on the right side are
sharply defined structures, so the error levels should not exhibit any significant deviations from the
central part of the image in this field."
Such a conclusion is entirely subjective in the course of an Error Level Analysis. This also applies to the claim that the
differences can not explain holistically the image content. The severity of the error level that is expected on such an image
is to be backed up with another comparison image from Google Earth with similar cloud from a different area.

Click to enlarge this image
Quotation of the Bellingcat report (p.11):
"This comparison photo shows how cloud cover very similar to that seen in "Picture 4" causes no significant
differences in error levels. Therefore, it is highly likely that the cloud in "Picture 4" is not part of
the original image and was added later."
The ELA methodology is, however, no statistical evaluation method and assessment for possible probabilities.
In which way can a high probability be derived? This is impossible. Accordingly, there is no mathematical description that explains
the classification of an undetermined "high probability". Subjectively as well, is the rating of the comparative image.
It lies in the eye of the observer, wether the error level changes are non-significant. Which measurement represents a relevant significance?
Well, this is also an indeterminate size.
The Error Level Analysis of an image that obviously has been changed by editorial staff is useless at this point.
It can be concluded now that there have been countless edits that have elementarily influenced the final image.
Furthermore it can be assumed that the original satellite image was present in a different image format and was
converted in a lossy JPG file for posting it on the Internet .
This image now has been greatly reduced by applying high compresion ratios and additonally has been overlaid with bars, marks and text boxes.
As part of such an operations, a contrast and brightness increase is to be considered.
It is also conceivable that selected portions of the template have been changed in contrast and brightness for presentation purposes.
These are legitimate processing steps that not necessarily prove a manipulative intent of counterfeiting.
The result of uneven error levels on such image template is hardly surprising and an expectable phenomenon.
The wrong tool at the wrong examination object was applied.
Pitfalls
It is crucial to know the source from where an image comes from.
A critical error in dealing with ELA methodology which is also evident in the Bellingcat report,
is the use of an obviously prepared image template and not an original satellite image.
Enforced answers
The Bellingcat working group would have been better off if they had avoided any details associated with the use of ELA methodology.
ELA results have finally no probative value. Instead, subjective evaluations entice to classic mistakes that sets an expected conclusion
as the only solution in such investigations. Likewise, it may happen that there are no evidences for or against a willfully executed
manipulation. Yes or no are not the only answer options.
Real or authentic?
If there is no information about the origin of the examined images, Error Level Analysis can not serve a binding statement as to whether
an image is real or authentic. The logical distinction between these two cases is too often left unconsidered in connection with
interpretations of ELA results. Indications of changes must be considered in the overall context. Selectively conducted graphical edits
in the photo material could also simply have served to make them visually more recognizable, without distorting the general state of affairs.
ELA methodology alone can not resolve this distinction.
Limitations
Compromising traces of manipulative image editing can be very easily removed in order to be immune to the ELA methodology.
Unambiguous conviction through Error Level Analysis are also proof of amateurish workmanship of the counterfeiter comparable
with the leave of fingerprints of the culprit at the scene.
Imagery from social platforms
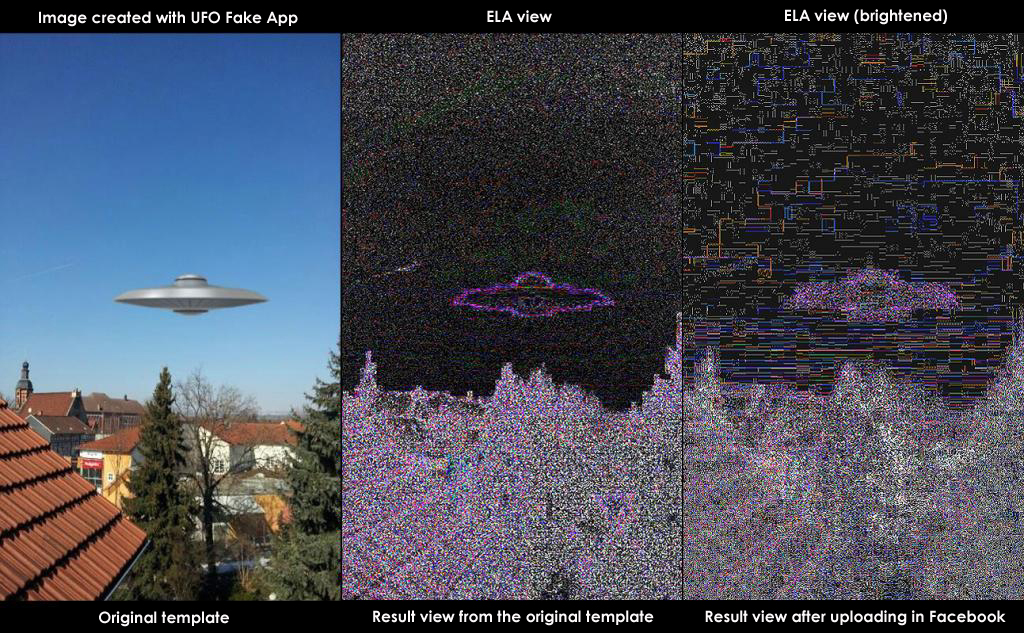
Image material, mostly from various social platforms (like Facebook, Twitter, and others), are in particular unusable for ELA tests.
When you upload the photos to online services, the photos are not applied by them in the original form. The online services in general create
a complete new copy in a low quality version. This newly conducted encoding further reduces existing compression potentials.

Click to enlarge this image
However, more things happen. Most of the meta information that existed in the original uploaded images have been removed.
As a result, this will eliminate several different forensic examination criteria. At least, examination of the data structure and
checking the ELA result can clearly determine that such images are not original camera image files.
Conclusion
Error Level Analysis may under certain conditions clearly indicate whether and where manipulations were made in the image.
This definiteness is given, however, only in few cases. In the majority of professional forensic image analyses the ELA
method is only used as one of various possible tools to obtain first hints which one can selectively pursue afterwards with further
methods.
Apart from those cases in which ELA can deliver an unambiguous result, it can not be invoked as evidence in other cases.
In the conclusion of a serious forensic analysis you can not argue with alleged evidences.
Either it is possible to give clear evidence of tampering or one abstains a binding statement due to the lack of usable data.
Those who does it anyway, devalue the methods and especially himself as serious analyst by error-prone and negligent practices.
References
|

